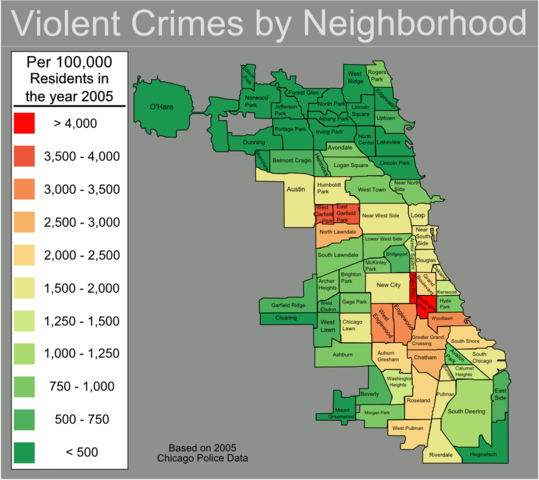
Next the familiar violent crime map of Chicago

As you can see some of the high crime areas tend to - but not always - correlate with high population loss areas. Did the high crime cause the population loss? Or did the population loss cause the high crime? Or is it a coincidence?
Moving on, here is a similar set of correlations between median income and oil prices. First, median household income for the post-war era.
As you can see there is a period of stagnation starting around 1974 and lasting until around 1985. There is a dip around 1991 and then things take off again until around 2002. Compare with this graph of oil prices.
You can see that periods of stagnation coincide roughly with spikes in oil prices. Is there a correlation?
I don't have conclusive evidence of causation for either scenario. I will continue to research these topics. Can we predict which neighborhoods will decline in population by studying crime statistics? Can we predict periods of income stagnation based on oil prices? Is it possible to graph the future? I hope you find it an interesting topic for thought and research. And I appreciate your point of view on this topic.

No comments:
Post a Comment